
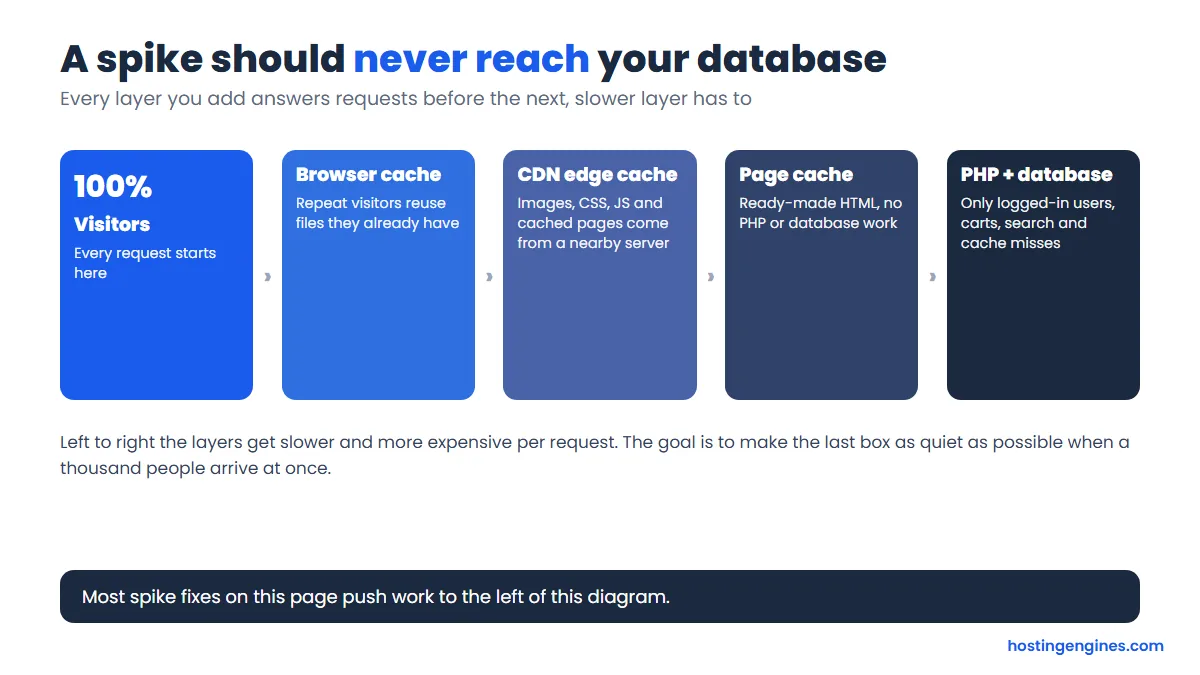
A traffic spike breaks a site when the server rebuilds every page for every visitor. So the job is simple: make the server do less work per visitor. This page is a do list. Work down it, tick each box, and check the result before you move on.
The steps assume WordPress, Cloudflare in front and either LiteSpeed hosting (Hostinger runs LiteSpeed) or any host that lets you install a cache plugin. Not sure the plan can cope at all? Read the signs you have outgrown shared hosting afterward.
Quick answer: Do these in order: read your host’s usage graph, turn on page caching, put Cloudflare in front with two cache rules, shrink the ten heaviest images, move WP-Cron to a real cron job, block the worst bot, then load test with k6. Upgrade only if CPU, RAM or processes stay pinned after that.
Rules to remember
- Cache pages at Cloudflare with one rule, and add a second rule last that bypasses admin, login, logged-in users and the cart.
- Free Cloudflare plans allow 10 Cache Rules and one rate limiting rule, which is enough.
- Judge a load test by p95 response time and failed requests, not by the average.
- Upgrade after caching has been tried, not before.
Your do list
Twelve actions, in the order that frees the most capacity for the least effort. Each one has its own section below with the exact clicks and values.
- ☐ Read your host’s usage graph and name the limit that is pinned (2 minutes)
- ☐ Turn on page caching and skip cart, checkout and logged-in pages (10 minutes)
- ☐ Set your DNS records to Proxied in Cloudflare (1 minute)
- ☐ Add two Cloudflare cache rules: cache pages, bypass private pages (5 minutes)
- ☐ Resize and compress your ten heaviest images (30 minutes)
- ☐ Move WP-Cron to a real cron job (10 minutes)
- ☐ Switch on a Redis object cache if your host offers one (10 minutes)
- ☐ Deactivate heavy plugins and cap post revisions (20 minutes)
- ☐ Find the biggest bad bot and block it, then rate limit the login page (10 minutes)
- ☐ Pause backups and scans while the event runs (1 minute)
- ☐ Load test a staging copy with k6 and read p95 and failures (30 minutes)
- ☐ Upgrade only if the limits still hit after all of the above
Do this now if the spike is already happening
Work these seven steps in order. Do not edit content, update plugins or change themes while the spike is running.
- Read the usage graph (2 minutes). On Hostinger open Websites, your site’s Dashboard, then the Resources usage page in the hosting plan section (Hostinger’s guide). On cPanel open Metrics, then Resource Usage. Done when: you can name the one limit being hit: CPU, memory or processes.
- Turn on the page cache (2 minutes). LiteSpeed Cache: LiteSpeed Cache, Cache, Cache tab, Enable Cache ON, then Toolbox, Purge All. Without LiteSpeed, install WP Super Cache (steps below). Done when: a second page load in a private window is much faster.
- Check the CDN proxy (1 minute). In Cloudflare open DNS, Records, and check the record for your domain shows Proxied (orange cloud), not DNS only. Done when: the response headers include cf-cache-status.
- Add the two cache rules (4 minutes). Caching, Cache Rules, Create rule, using the exact fields in the Cloudflare section below. Done when: two requests to your home page return MISS, then HIT.
- Pause backups and scans (1 minute). Pause scheduled backups in the host panel and any security plugin scan. Done when: nothing heavy is scheduled for the next hour.
- Block the obvious offender (3 minutes). Cloudflare, Analytics, Events tab, Top events by source. If one IP, user agent or path dominates, filter it, then block it. Done when: request counts from that source drop to zero.
- Deactivate the heaviest plugin (2 minutes). Plugins, Installed Plugins, deactivate the ones that work on every page and add nothing to the spike: popups, related posts, live chat, page builder add-ons. If wp-admin will not load, rename the plugin’s folder in wp-content/plugins with the host’s File Manager. Done when: pages load faster with the plugin off.
Still failing? Turn on Cloudflare’s Under Attack Mode as a last resort. It puts every visitor behind a short browser check, so turn it off afterward. If the usage graph is still pinned with the cache working, you have hit the plan’s limit, and the signs you have outgrown shared hosting apply.
Do this before the next spike
Set the cache and CDN up a week ahead so you can test with logged-out and logged-in visits. Then follow this timeline. The place to do each task is in brackets.
One week before
- ☐ Write down your plan limits (CPU, RAM, processes) and find the usage page (host panel)
- ☐ Update and delete unused plugins, then turn the page cache on (WordPress)
- ☐ Set DNS to Proxied and add both cache rules (Cloudflare)
48 hours before
- ☐ Resize and compress the hero and top ten images (WordPress)
- ☐ Move WP-Cron to a real cron job (host panel and wp-config.php)
- ☐ Run the k6 load test against a staging copy (your computer)
One hour before
- ☐ Purge all caches, then open the key pages once to warm them (WordPress)
- ☐ Pause backups and switch uptime alerts on (host panel)
- ☐ Open Analytics, Events and note the normal bot level (Cloudflare)
During the spike
- ☐ Watch CPU, memory, processes, cache hit rate and Events. Change nothing else
After the spike
- ☐ Note the peak and any errors
- ☐ Remove temporary rules
- ☐ Resume backups
Turn on page caching
Run one page cache only: LiteSpeed Cache on LiteSpeed hosting, WP Super Cache anywhere else. Settings come from the LiteSpeed Cache documentation.
Route A: LiteSpeed Cache
- Install and activate the free LiteSpeed Cache plugin, then open LiteSpeed Cache, Cache.
- Make the Cache tab match the table below. These are the defaults, so most sites only check.
- In Drop Query String add, one per line:
fbclid,gclid,utm_source,utm_medium,utm_campaign. Tagged links then share one cache entry. - On Excludes, add
/cart/,/checkout/and/my-account/to Do Not Cache URIs, one per line. - Leave the TTL tab on its defaults (7 days public, 30 minutes private). On a site that publishes many times a day, set Public and Front Page TTL to 86400.
- Save, then Toolbox, Purge All.
| Tab | Setting | Value | Why |
|---|---|---|---|
| Cache | Enable Cache | ON | Turns page caching on |
| Cache | Cache Logged-in Users | ON (private cache, 1800 s) | Plugin default, safe because it is per user |
| Cache | Cache Commenters | ON | Plugin default |
| Cache | Cache REST API | ON | Plugin default |
| Cache | Cache Login Page | OFF | Never cache the login form |
| Cache | Cache Mobile | OFF | Only needed with a separate mobile theme |
| Cache | Drop Query String | fbclid, gclid, utm_source, utm_medium, utm_campaign | Tagged links share one cache entry |
| TTL | Default Public Cache TTL | 604800 | 7 days, purged on post updates |
| TTL | Default Front Page TTL | 604800 | Lower to 86400 on a daily news site |
| TTL | Default Private Cache TTL | 1800 | 30 minutes for logged-in users |
| Excludes | Do Not Cache URIs | /cart/ /checkout/ /my-account/ (one per line) | Private pages must never be shared |
Done when: in a private window, reload your home page and open Network in the browser developer tools. The page request shows x-litespeed-cache: hit. Our HTTP Headers Checker shows the same headers. Log in and check again: a logged-in view must not come back as a public hit.
Route B: WP Super Cache
- Install and activate WP Super Cache, open Settings, WP Super Cache, and switch caching on.
- Choose Simple delivery. The plugin recommends it, and Expert mode needs risky .htaccess edits.
- On the Advanced tab tick Compress pages, Don’t cache pages for known users, Cache rebuild and Extra homepage checks.
- Set the cache timeout to 1800 seconds, with a timer of 600 seconds for frequently updated sites.
- On the Preload tab turn on preloading at 2880 minutes (2 days) if your sidebar rarely changes.
Done when: the page source of a logged-out view ends with a comment saying WP Super Cache served it, and the second load is visibly faster. URLs with utm_source parameters are not supercached, so expect misses on tagged links.
Cache your pages at Cloudflare
Cloudflare caches files, not HTML, until you add a rule. Add one rule that caches pages and a second that bypasses private pages. The second must come last, because Cloudflare applies the value from the last matching rule (Cache Rules).
- DNS, Records: make sure the records for your domain and for www show Proxied.
- Caching, Cache Rules, Create rule. Name it Cache WordPress pages. When incoming requests match: Custom filter expression
(http.host eq "example.com"), with your domain. Then: Eligible for cache. Edge TTL: Ignore cache-control header and use this TTL, 2 hours. Place at: First. Deploy. - Create a second rule named Bypass WordPress private pages. Choose Edit expression and paste the code below. Then: Bypass cache. Place at: Last. Deploy.
(starts_with(http.request.uri.path, "/wp-admin"))
or (http.request.uri.path eq "/wp-login.php")
or (http.cookie contains "wordpress_logged_in")
or (http.cookie contains "comment_author")
or (http.cookie contains "woocommerce_items_in_cart")
or (starts_with(http.request.uri.path, "/cart"))
Warning: do not skip rule 2. A cache-everything rule also caches dynamic content, so one visitor could be served a page meant for someone else. Add the paths your site uses for members and checkout, and check the cookie names if you run a membership plugin. Free plans allow 10 Cache Rules, so two is well inside the limit.
Done when: from a terminal run curl -sI https://example.com/ twice. Look at cf-cache-status: the first is usually MISS, the second HIT. Then send a login cookie, for example curl -sI -H "Cookie: wordpress_logged_in_test=1" https://example.com/. It must not come back HIT. Without a terminal, use the HTTP Headers Checker for the first test. If you want the concepts behind this, see what a CDN is and the benefits of using a CDN.
Shrink your heaviest images
| Target | Value | Why |
|---|---|---|
| Width | About 1,200 px for a content column | Wider files are shrunk by the browser anyway |
| Content image weight | Under 150 KB | Our target, keeps pages light |
| Full-width hero | Under 250 KB | Our target |
| Format | WebP | Smaller than JPG or PNG at similar quality |
| Quality | 75 to 82 for photos | Usually hides compression |
- Run your busiest page through the Page Size Checker and note the ten largest images.
- Resize them to about 1,200 px wide and convert to WebP with the browser-based WebP Converter. Nothing is uploaded.
- For the whole library, use an image optimization plugin with a bulk mode, such as EWWW Image Optimizer, or process a folder on your computer and re-upload.
- Lazy-load below the fold only. Never lazy-load the first big image.
Done when: the Page Size Checker shows a lower total page weight, and the largest files are your hero images, not forgotten uploads.
Move WP-Cron to a real cron job
WordPress runs scheduled tasks on every page load, so a spike adds background work on top of visitors. Switch that off and run a real cron job instead (WordPress Developer Handbook).
- Open wp-config.php in the host’s File Manager and add the first line below, above the comment that says That’s all, stop editing.
- Open the host cron job page. On Hostinger it is Websites, Manage, Dashboard, Cron Jobs (Hostinger’s cron guide). Choose Custom, every 5 minutes (
*/5 * * * *). - Use the second line below as the command, with your own address. Run it every 15 minutes if you do not publish scheduled posts.
- Hostinger cron times run in UTC, so allow for that when you schedule other jobs.
define( 'DISABLE_WP_CRON', true );*/5 * * * * wget --delete-after https://example.com/wp-cron.phpDone when: in the free WP Crontrol plugin, Tools, Cron Events, the Next Run column keeps moving, and a scheduled post publishes on time.
Set up a Redis object cache
Do this only if your host offers Redis or Memcached. It helps pages that cannot be page-cached: carts, searches and logged-in views.
- Ask the host: “Does my plan include a Redis (or Memcached) server, and what are the host, port and any password?” If the answer is no, skip this task.
- With LiteSpeed Cache: open LiteSpeed Cache, Cache, Object tab. Turn Object Cache ON, set Method to Redis, enter the Host and Port your host gave you, save, then read the Status line (object cache settings).
- Or install Redis Object Cache, add any connection constants your host requires to wp-config.php, and enable it on the plugin settings screen. Use one object cache plugin, not two.
Done when: the plugin status shows connected and the cache hit ratio climbs as you browse logged in.
Remove heavy plugins and clean the database
- On a staging copy, install the free Query Monitor plugin, open a page, open Queries from the admin bar and sort by time. Note any plugin that dominates.
- Deactivate that plugin, test the page, and delete it if you do not need it. Keep one plugin per job.
- Add
define( 'WP_POST_REVISIONS', 5 );to wp-config.php, next to the cron line. - Take a backup, then use a database cleanup plugin or WP-CLI to remove expired transients and old revisions.
- In phpMyAdmin, check that the Engine column for your tables says InnoDB.
Done when: Query Monitor shows fewer and faster queries per page, and your uncached TTFB drops.
Find and block abusive traffic
- In Cloudflare, open Analytics, then the Events tab. Under Top events by source read IP Addresses, User Agents, Paths and ASNs, hover the biggest value and choose Filter (security events).
- No Cloudflare? Open your log viewer or a downloaded access log and run the two commands below for the top IPs and the top URLs. In the common log format the first field is the IP and the seventh is the path.
- Block the biggest offender, or create the rate limit rule in the table below: Security rules, Create rule, Rate limiting rules (rate limiting rules).
- Turn on Bot Fight Mode under Security, Bots. It is free, but it can challenge API or mobile app traffic, so test your app and checkout afterward.
awk '{print $1}' access.log | sort | uniq -c | sort -rn | head
awk '{print $7}' access.log | sort | uniq -c | sort -rn | head| Rate limiting field | Value |
|---|---|
| Rule name | Limit login |
| Field / Operator / Value | URI Path equals /wp-login.php |
| With the same characteristics | IP |
| When rate exceeds | 10 requests per 10 seconds |
| Then take action | Block |
| Duration | 10 seconds (the free plan option) |
Free plans get one rate limiting rule, counted per IP over 10 seconds, so aim it at the one path being hit (free plan limits). Do not block Googlebot or your uptime monitor.
Done when: Events shows the blocked requests, and the process and CPU graphs on your host fall within minutes.
Load test before the spike
- Tell your host first, because heavy tests can look like an attack.
- Install k6 (k6 documentation), save the script below as
script.jsand point it at your staging copy. Runk6 run script.js. - Raise the load without editing the file:
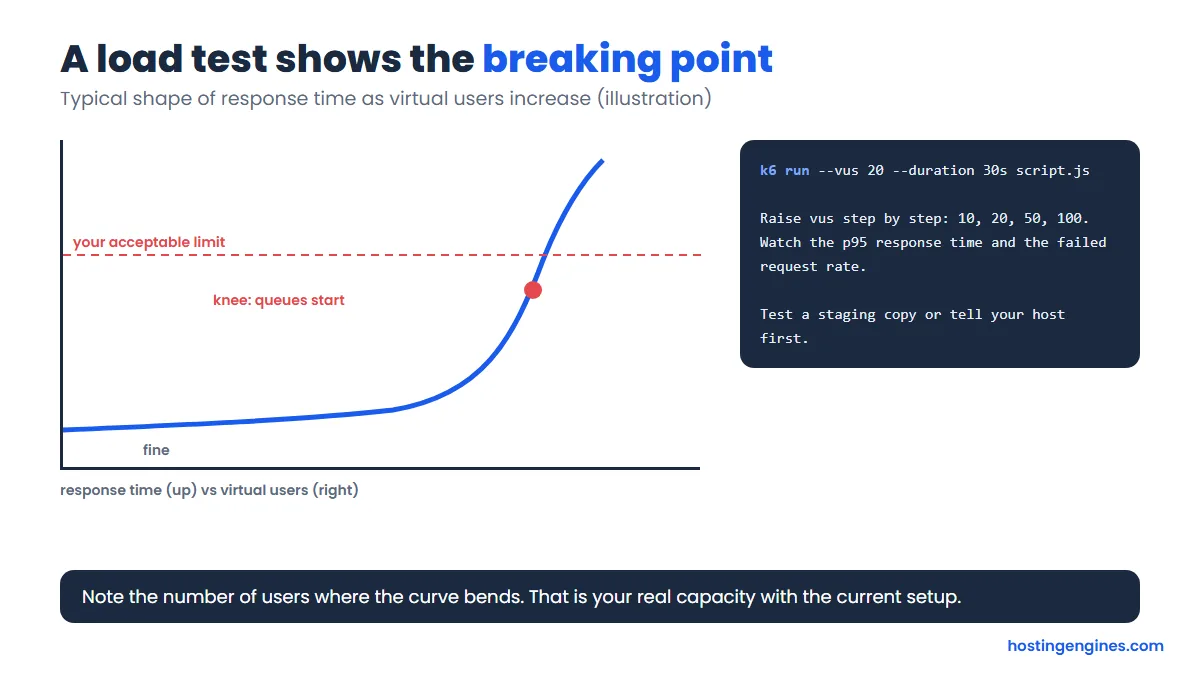
k6 run --vus 50 --duration 30s script.js, then 100. - Test a cached page and an uncached one (a search or a logged-in view). The uncached result is your worst case.
- Read p95 and failed requests in the first table, then act on the second.
import http from 'k6/http';
import { check, sleep } from 'k6';

export const options = {
  vus: 20,
  duration: '30s',
  thresholds: {
    http_req_failed: ['rate<0.01'],
    http_req_duration: ['p(95)<800'],
  },
};

export default function () {
  const res = http.get('https://staging.example.com/');
  check(res, { 'status was 200': (r) => r.status === 200 });
  sleep(1);
}| In the k6 summary | What it tells you | Target |
|---|---|---|
| http_req_duration p(95) | Response time that 95 in 100 requests beat, so it shows what slow visitors feel | Under 800 ms (our rule of thumb) |
| http_req_failed | Share of requests that errored | Under 1% |
| checks | Share of your own checks that passed, here status 200 | As close to 100% as possible |
| vus | Virtual users at the time of the run | Raise it step by step: 10, 20, 50, 100 |
| Result | What it means | Do this |
|---|---|---|
| p95 under 800 ms and failures under 1% | Capacity is fine for that many users | Test the next step up, then stop |
| p95 rising, no failures | The server is queueing requests | Add or fix caching, then retest |
| Failures above 1% | A limit is being hit | Check the host graph for the limit, fix, retest |
| Only uncached pages are slow | Database or plugins are the bottleneck | Object cache, plugin cleanup |
| Breaks below your expected peak with caching on | The plan is too small | Upgrade, move to a VPS, or autoscaling |
The 800 ms and 1% limits are our rules of thumb, not standards. Pick numbers your visitors would tolerate and keep them the same from test to test.
Match the symptom to the fix
Find what you see, then do the fix. If several symptoms appear together, start with caching.
| Symptom | Likely cause | Fix |
|---|---|---|
| 503 at busy times | Process, RAM or CPU limit reached, or maintenance, a plugin conflict, an attack | Page cache, CDN rules, block bots. Read the error log first |
| 508 Resource Limit Is Reached | CloudLinux limit hit, most often entry processes (concurrent PHP requests) | Cache so requests finish faster, remove slow plugins, find a bot in the logs |
| Slow only when logged in or in the cart | Those pages bypass the page cache | Object cache, fewer plugins, faster queries |
| Slow TTFB on every page | Uncached PHP, slow database or too little CPU | Page cache, then object cache, then a bigger plan |
| Bandwidth warning from the host | Heavy images, video or downloads, or a bot | Image targets, CDN for static files, block scrapers |
| Database connection errors | Too many connections or a stuck query | Object cache, cap plugins, ask the host for the limit |
| CPU pinned at the limit | Dynamic pages and background jobs | Page cache, real cron, pause backups |
Decide whether to upgrade
Upgrade when you have cached, trimmed and filtered and the limits still hit: CPU, memory or processes pinned on the host graph, 503 or 508 errors at peak even on cached pages, or a load test that breaks below your normal busy hour.
| Fix the site first if | Upgrade the plan if |
|---|---|
| It is slow even with few visitors | 503 or 508 errors appear at peak even on cached pages |
| There is no page cache or CDN yet | CPU, RAM or processes stay pinned on the host graph |
| Images are huge and plugins are many | The host warns you about resources every week |
| One bot is hammering one URL | The load test breaks at your normal busy hour |
A rule of thumb some hosts give is that hitting the process or memory limit 10 to 20 times in a month means you need more resources. Treat it as a guideline. Our guide to when to leave shared hosting covers the nine signs and the usual next steps.
If spikes are regular and unpredictable, compare the options below. Cloudways Autonomous prices come from our Cloudways Autonomous guide, so recheck them before you buy. To compare hosting types, read shared hosting vs VPS.
| Option | How it handles a spike | Trade-off |
|---|---|---|
| Cloudways Autonomous | Kubernetes adds servers behind a load balancer and removes them afterward. Plans start at $99 a month with 100 PHP workers per server, and extra servers cost $0.07 to $0.12 an hour | Higher base price, built for WordPress |
| Managed WordPress hosts | Plans are sized by monthly visits and include caching and a CDN | You pay for the tier, not just the spike |
| VPS you resize | Upgrade CPU and RAM before a planned launch, then scale back | Needs notice and server skills |
| Bigger shared plan | Higher limits per account on a shared server | Still capped and shared |
FAQ
Can I handle a traffic spike on cheap shared hosting?
Often yes, if almost every request is answered from cache. Turn on page caching, put Cloudflare in front with cache rules, shrink images and block bots. If the host’s usage graph is still pinned after that, the plan is too small.
Does Cloudflare’s free plan cache my WordPress pages?
Only if you tell it to. Cloudflare does not cache HTML by default. A Cache Rule with Eligible for cache fixes that, and a second rule must bypass wp-admin, login, logged-in cookies and the cart. Free plans allow 10 Cache Rules.
Is it safe to turn off WP-Cron?
Yes, as long as you replace it. Add the DISABLE_WP_CRON line and create a real cron job that calls wp-cron.php every 5 to 15 minutes. Otherwise scheduled posts, backups and updates silently stop.
What is a good p95 response time in a load test?
There is no official number. Under 800 ms on cached pages with fewer than 1% failures is a sensible target for most content sites. What matters is that the number stays flat as users increase.
Should I upgrade before a big launch?
Not automatically. Set up caching and the CDN, load test, and read the results. Upgrade or switch to autoscaling for the event only if the test breaks below your expected peak.
Do this next: set a calendar reminder for one week before your next launch and run the timeline above. The first hour of a real spike is a bad time to learn where the Cache Rules menu is.