Trying to decide between Vultr’s High-Performance plans: AMD or Intel? Wondering which is the best and fastest for your web app hosting?
I have tried them both and put them into a series of tests to see the best Vultr High-Performance plan; AMD or Intel.
After doing the tests, I came to the following conclusion:
- Vultr AMD Instance performs slightly better than Intel. Especially, when you need a powerful CPU like when hosting high-resolution images.
- The Intel servers are still competent and not significantly behind. If you prefer Intel CPUs, they are a viable choice.
- The table below shows the speed test results of an empty WordPress website:
| Comparison | AMD “seconds” | Intel “seconds” |
|---|---|---|
| PageSpeed Desktop LCP | 0.7 | 0.7 |
| PageSpeed Mobile LCP | 2.7 | 2.7 |
| GTmetrix | 0.586 | 0.607 |
| Pingdom | 0.756 | 0.728 |
- The table below shows the speed test results of a WordPress website loaded with images and content and without optimization:
| Comparison | AMD “seconds” | Intel “seconds” |
|---|---|---|
| PageSpeed Desktop LCP | 0.9 | 1.2 |
| PageSpeed Mobile LCP | 4.1 | 4.0 |
| GTmetrix | 1.1 | 1.2 |
| Pingdom | 1.53 | 1.68 |
Read Vultr High Performance vs. High Frequency comparison.
If you want to know more about how we performed our speed tests, on both server types, keep reading.
What is Vultr High Performance?
Vultr High Performance stands as one of Vultr’s best VPS plans, providing top-notch resources with the latest technologies.
This plan offers two CPU options you can choose from:
- The AMD CPU option uses the new generations of AMD EPYC
- The Intel CPU option is powered by the latest Intel Xeon CPUs.
High-Performance pricing starts at $6 per month for both AMD and Intel.
For $6/month, you get dedicated resources on a shared physical CPU of 1 GB RAM, 1 vCPU processor, 2 TB Bandwidth, and 25 GB NVMe SSD.
The two options look a lot like each other, except for the processor type, one is Intel and the other is AMD.
Read Vultr review.
Vultr AMD vs Intel Test Setup
To create a fair environment for the test we created an AMD VPS server and an Intel VPS server with the same plan, and the same resources, and in the same data centers.
Also, we installed the same WordPress version with the same theme and the same plugins and demo sites to be identical.
The two servers are the $6 (1GB RAM) plans and the location of the server is in New York (NJ). The operating system is Ubuntu 20.04 and on top of it, I installed WordPress.
The tools that will be used are Google PageSpeed Insights, GTmetrix, and Pingdom Speed Test.
Terms Used in the Test:
Before we start the tests, you might need to know some phrases and what they mean to fully understand the aspects of the Core Web Vitals. These terms will be mentioned in this comparison many times.
- PageSpeed Insights: A web performance tool created by Google to help webmasters improve the speed of their websites. It provides insights into the performance of a website and helps identify the factors that can impact its speed and performance.
- GTmetrix: A free web performance testing tool that helps you understand your website’s strengths and weaknesses. It provides a convenient way to measure the performance of your website in terms of speed, page load time, and other metrics.
- Pingdom: A website speed performance monitoring tool. It tests the connection speed of a website and provides valuable insights about the load time, server response time, and page load time.
- Speed Index: An indication of how fast your site is loading. It tells you how quickly users will perceive your site, and what kind of impact it has on their experience.
- First Contentful Paint “FCP”: A measure that helps to know how quickly a website will be able to display the first content of a web page after the user clicks on the link.
- Largest Contentful Paint “LCP”: A measure that helps to know how quickly a website will be able to display the full content of a web page after the user clicks on the link.
- Time to Interactive: Calculated by measuring how long it takes for a website visitor’s browser to load before they can start interacting with the site. This includes everything from downloading files to navigating through the web page and other pages.
- Total Blocking Time “TBT”: Tells you how much time is blocked by scripts during your page loading process. This is important because the more time it takes for your page to load, the less likely visitors are to stick around and click on any links or form submissions.
- Cumulative Layout Shift “CLS”: Indicates how much layout shift is experienced by visitors as your page loads. The more shifts there are, the less smooth your website will be for your visitors. For a good user experience.
- Web Page Structure: A score helps check where you are on the optimization scale and how much work needs to be done before your page can reach its potential.
- Web Page Load Time: A metric used to measure how quickly a website loads and displays its content. It’s measured in seconds and milliseconds.
- Web Page Size: Measured in megabytes (MB). The larger the page size, the more content is on a single page, which can make it slower to load.
- Web Page Requests: The requests that the web page makes to import the full page. The fewer requests the faster the loading time.
Vultr AMD vs Intel Test Results
After we installed the two servers and the WordPress application on both we made a series of speed tests and here are the results.
One series is with an empty WordPress application and another with a fully designed WordPress theme and templates without WordPress optimization.
First: Empty WordPress Website:
Here are the test results on a simple WordPress website without any content.
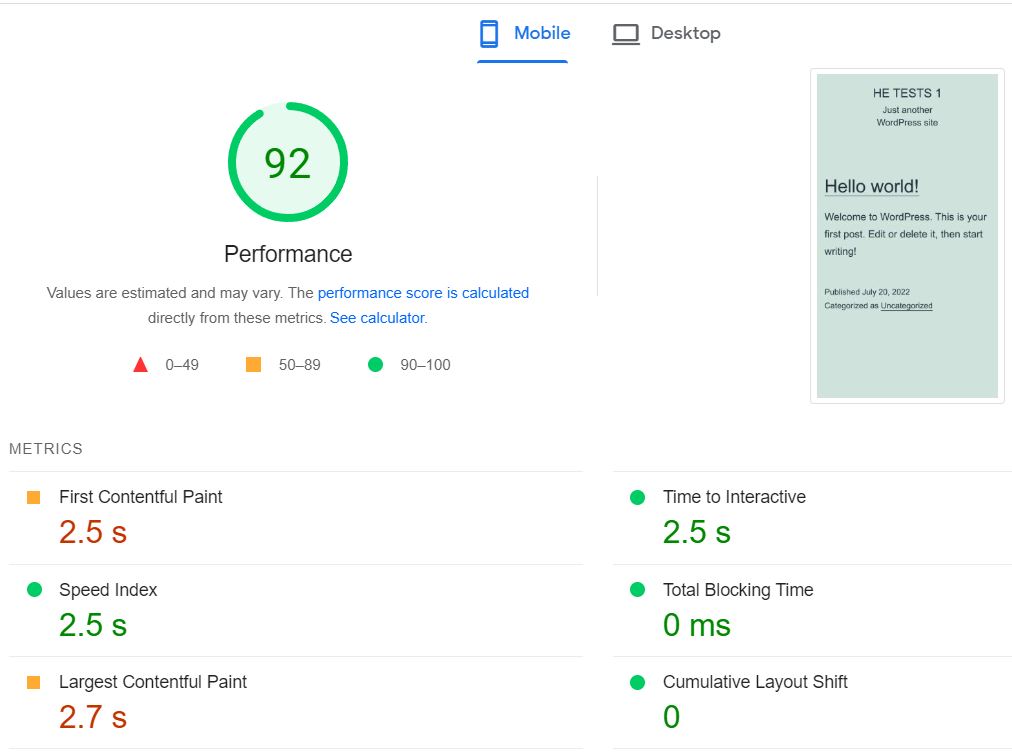
1. Vultr AMD PageSpeed Insights (Mobile) tests:
It is clear from the image below that AMD’s speed score on the mobile version is impressive as the mobile version always hard to get such results.
The Largest Contentful Paint is 2.7 seconds considering that optimizing the website reflects a good impression about the Vultr AMD VPS. However, this is on an empty site.
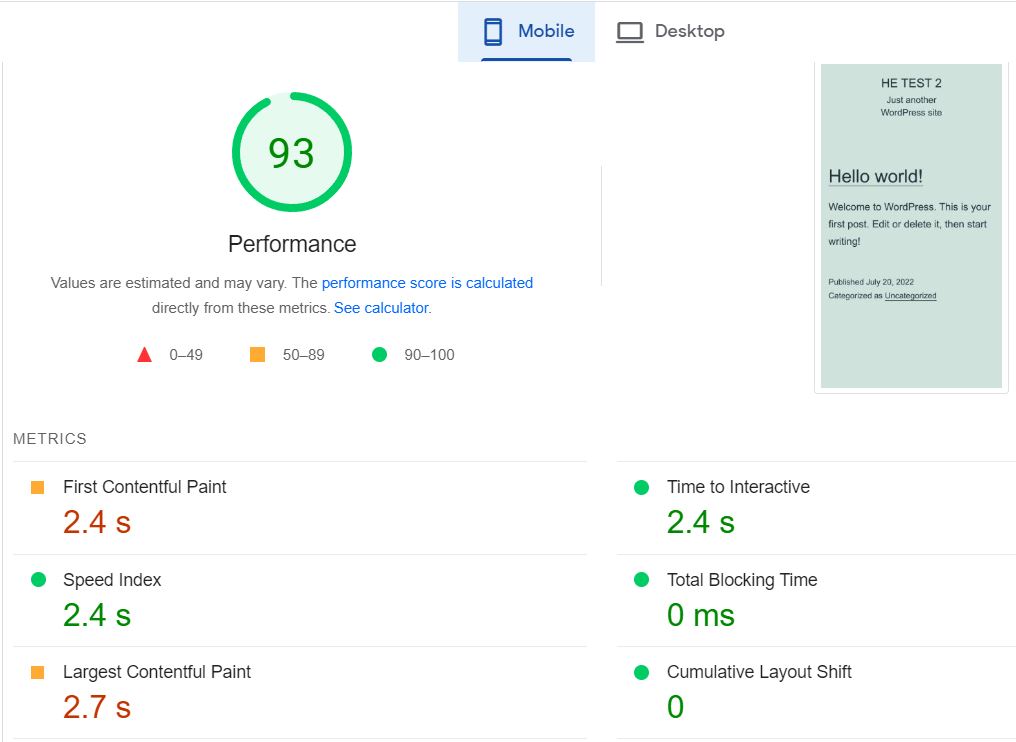
2. Vultr Intel PageSpeed Insights (Mobile) test:
The Intel processor on Vultr scores %93 on the PageSpeed Insights speed test, a bit better than AMD CPUs
However, there’s not much of a difference between the two of them except for the Speed Index and the Time to Interactive. Still, the winner here is Intel CPUs.
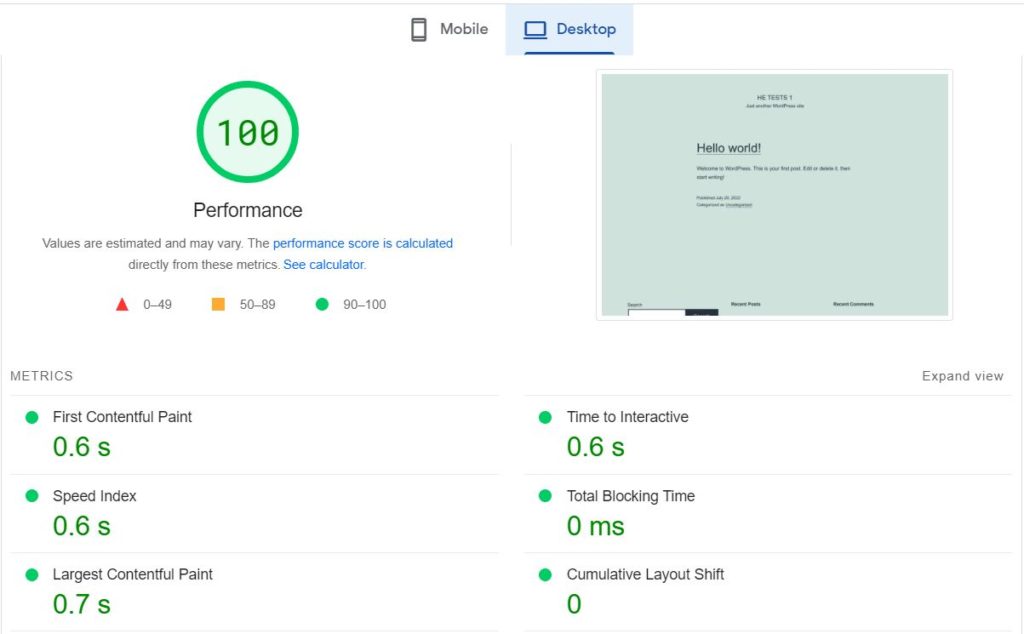
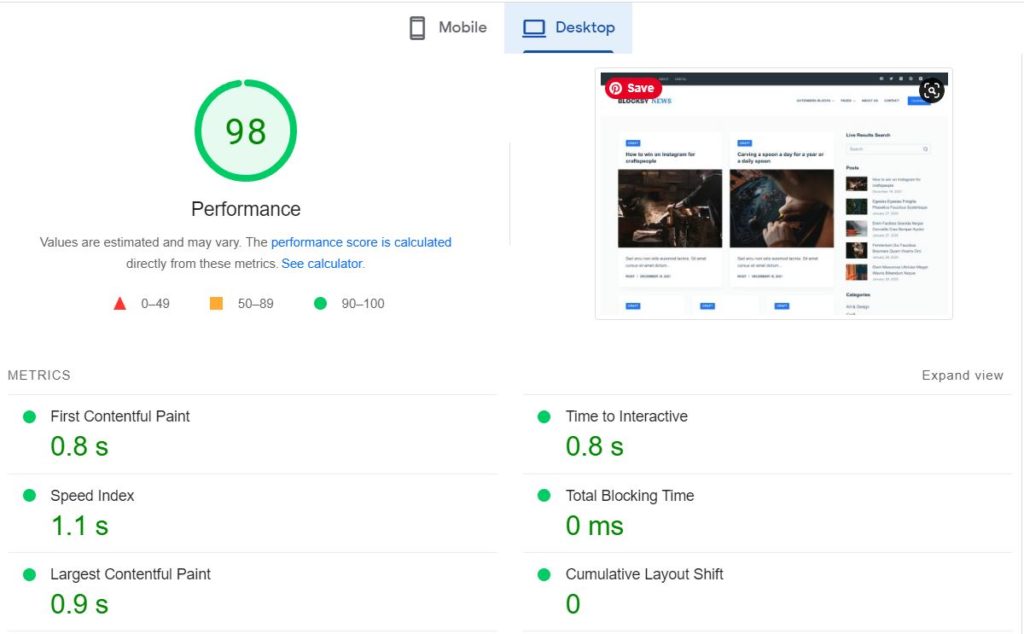
3. Vultr AMD PageSpeed Insights (Desktop) test:
The AMD VPS on the Desktop test is literally insane. The results are impressive. The performance score on the PageSpeed Insights speed test tool is %100.
Also, the Largest Contentful Paint is 0.7 seconds and that’s an impressive result.
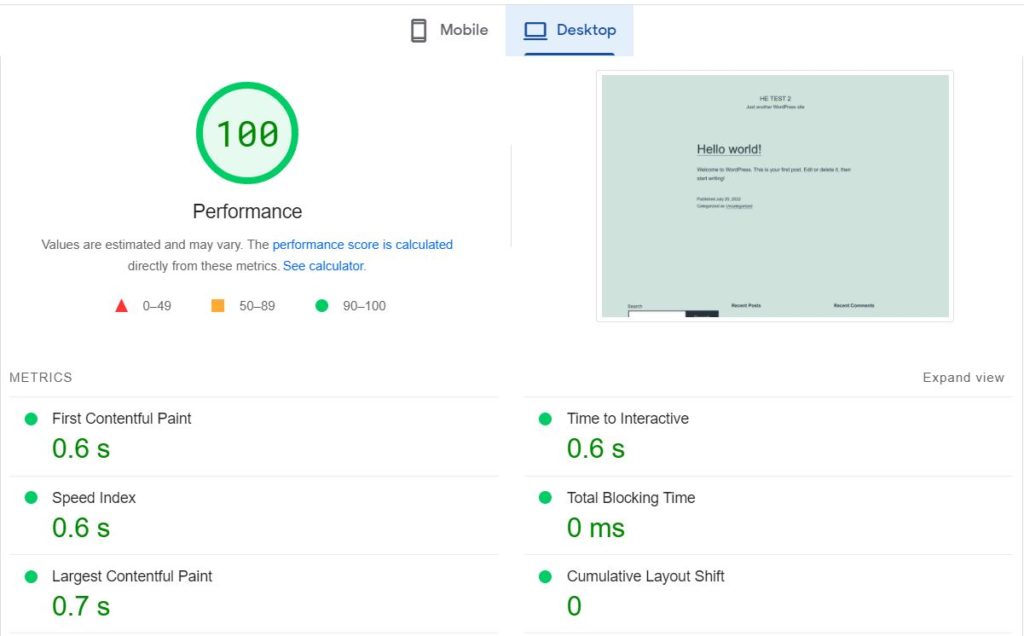
4. Vultr Intel PageSpeed Insights (Desktop) test:
The server on Intel got the same results as AMD. The performance score on the PageSpeed Insights speed test tool is %100 and the Largest Contentful Paint is 0.7 seconds.
So, it’s a win-win for both Vultr VPSs AMD and Intel.
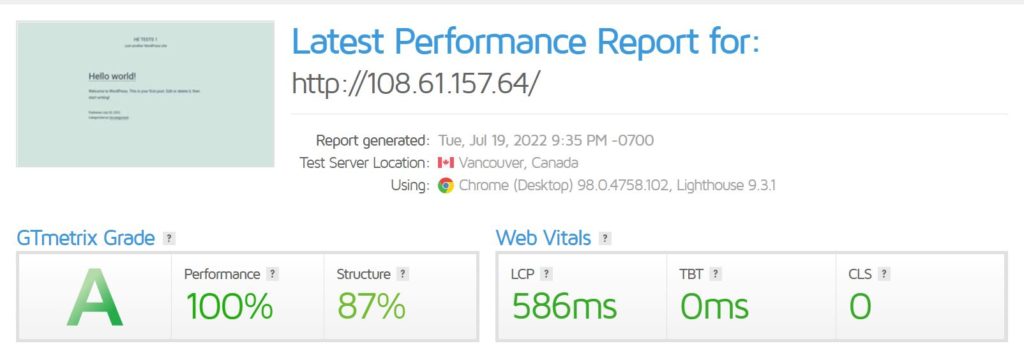
5. Vultr AMD GTmetrix speed test result:
AMD scores 0.586 seconds Largest Contentful Paint on GTmetrix speed performance. That’s less than 6 seconds.
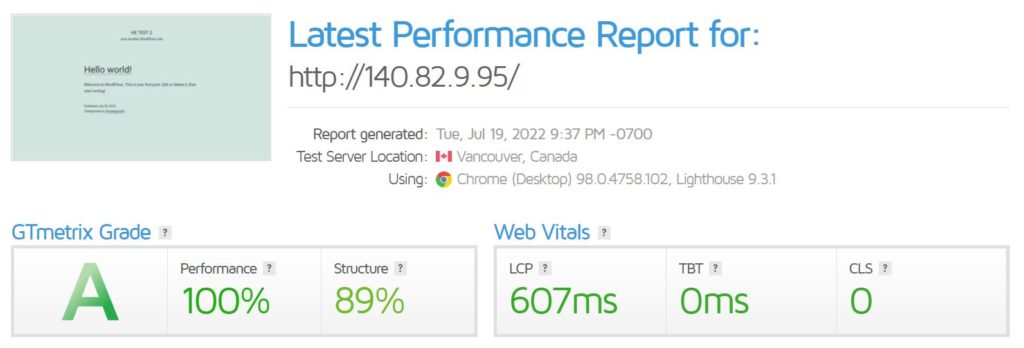
6. Vultr Intel GTmetrix speed test result:
Not far behind AMD, intel scored 0.607 seconds Largest Contentful Paint on GTmetrix speed performance. So, AMD is a winner in this test.
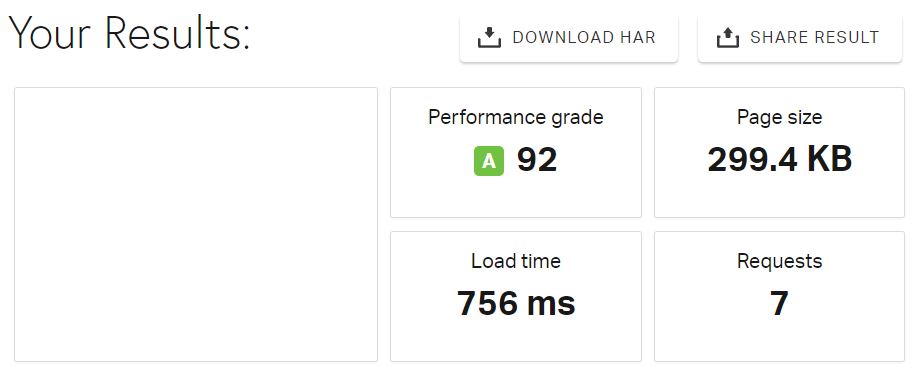
7. Vultr AMD Pingdom speed test result:
On Pingdom, Vultr AMD scored 0.756 seconds on website speed and a 92 performance grade.
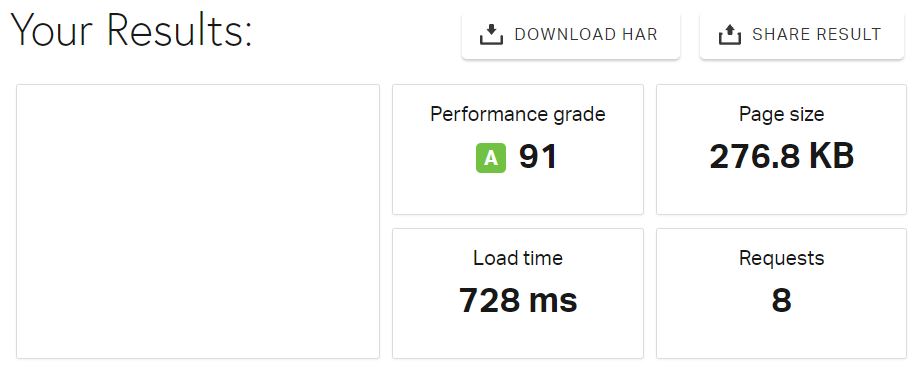
8. Vultr Intel Pingdom speed test result:
On Pingdom, Vultr Intel scored 0.728 seconds in website speed and a 91 performance grade. The AMD performance is better, but the average load time on the Intel server is faster than on AMD.
Second: Website With Content:
The results below are after loading an entire news site with a lot of content and images without optimizing the website for better performance.
After optimizing the website like using cache and minified plugins, the website will perform even better.
We see a lot of websites with shared hosting scores anywhere between 20 to 40, and they perform way better when they have been optimized with speed and caching software.
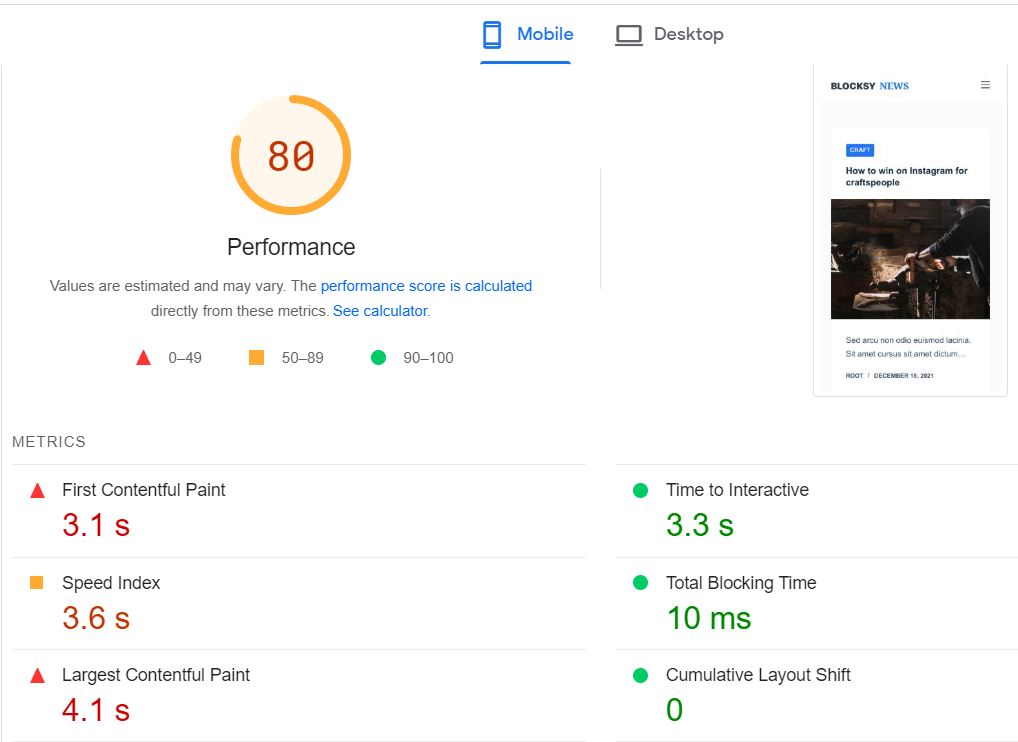
1. Vultr AMD PageSpeed Insights Mobile test:
The speed performance of the AMD processor on Vultr has scored 80% on the PageSpeed Insights on the mobile version and the Largest Contentful Paint scored 4.1 seconds.
Still not bad considering the website has not yet been optimized for speed and this is on the mobile version. So, it may get better after you install one or two WordPress plugins.
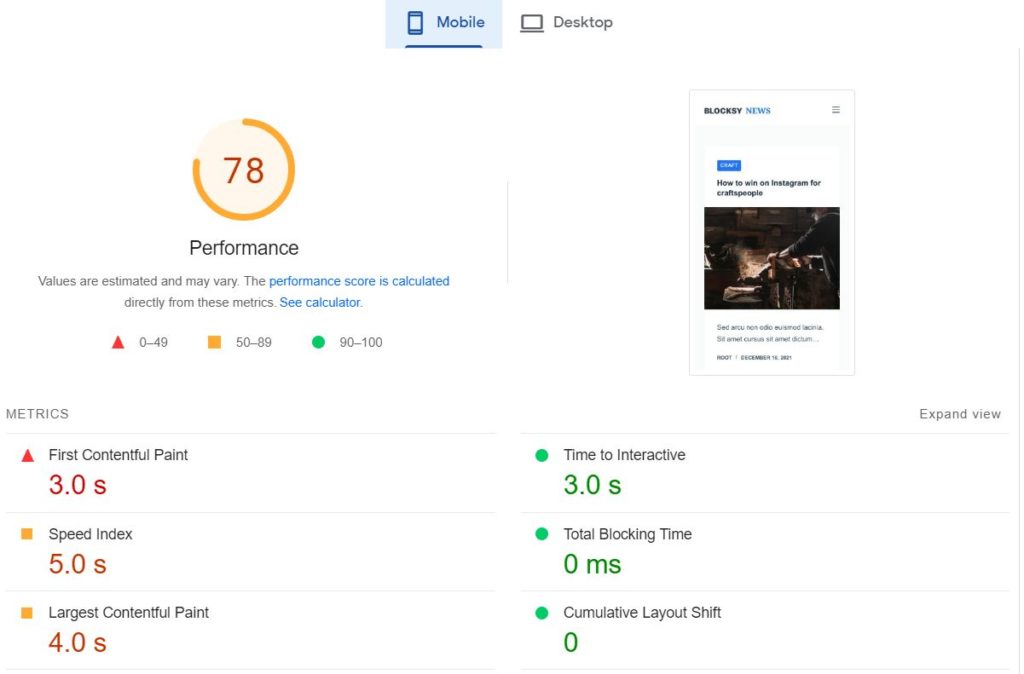
2. Vultr Intel PageSpeed Insights Mobile test:
Intel scored 78% overall performance on the PageSpeed Insights on the mobile version and the Largest Contentful Paint scored 4 seconds.
The overall result was AMD won it, but still, Intel was faster by 0.01 seconds.
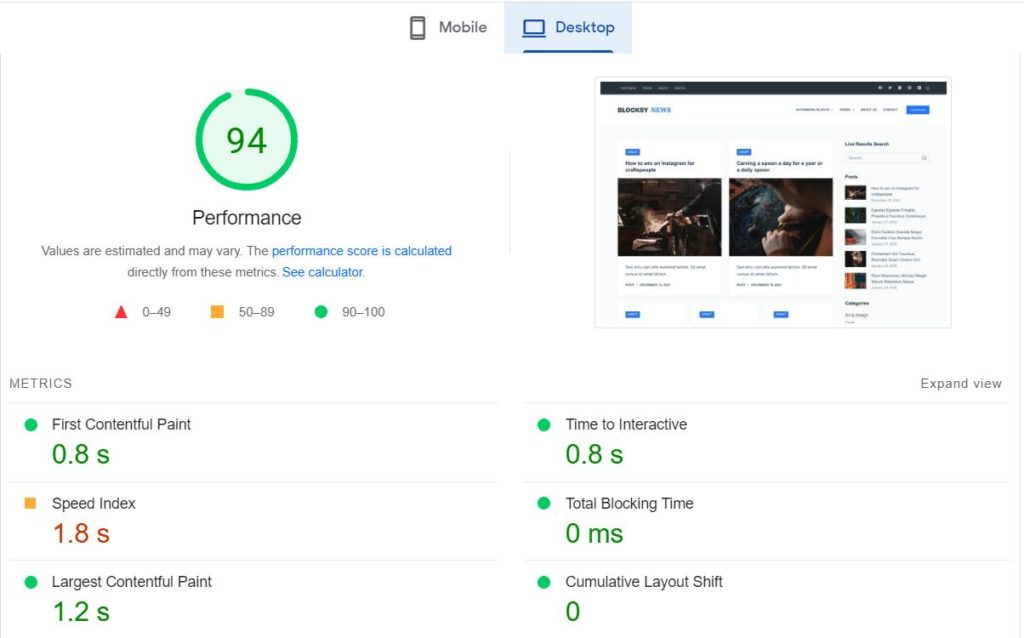
3. Vultr AMD PageSpeed Insights Desktop Test:
This is when the results start to get better for AMD processors. Vultr AMD scores 98% overall performance and 0.9 seconds Largest Contentful Paint.
4. Vultr Intel PageSpeed Insights Desktop test:
Vultr Intel scores 94% overall performance and 1.2 seconds Largest Contentful Paint on PageSpeed Insights Desktop Speed Test Result.
The gap in this test increased to reach 0.3 seconds and 4 overall performance in favor of the AMD CPUs.
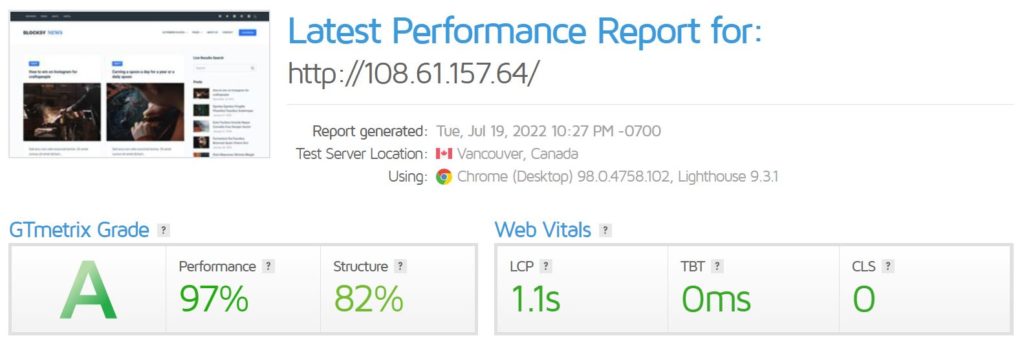
5. Vultr AMD GTmetrix speed test result:
GTmetrix speed and performance test on AMD scores 97% performance and 1.1 seconds loading time.
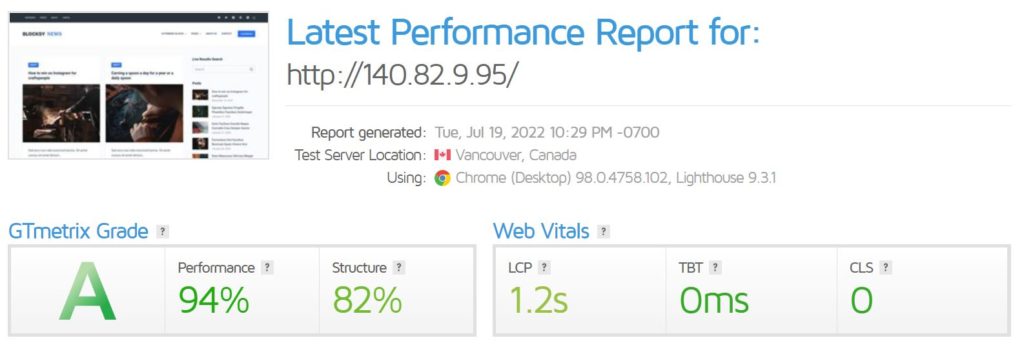
6. Vultr Intel GTmetrix speed test result:
GTmetrix speed and performance test on Intel scores 94% performance and 1.2 seconds loading time. That again makes it behind AMD.
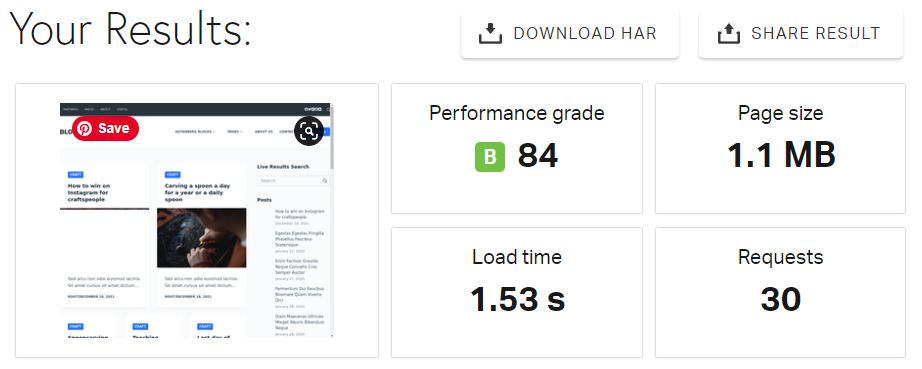
7. Vultr AMD Pingdom speed test result:
On the Pingdom speed test, the Vultr AMD server scores 84 and the loading time is 1.53 seconds.
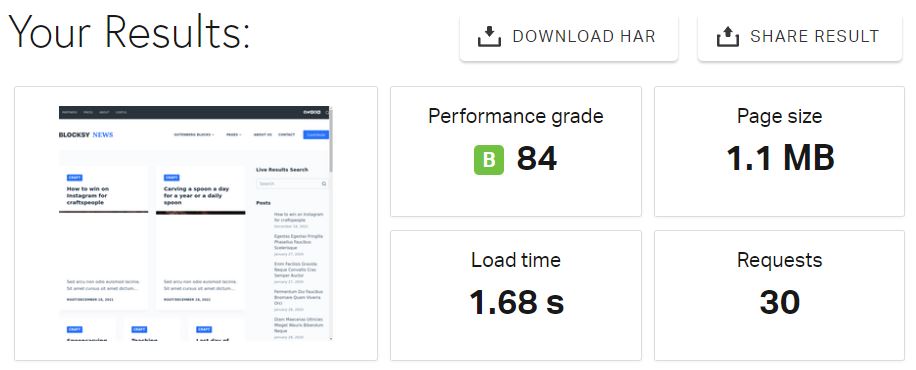
8. Vultr Intel Pingdom speed test result:
On the Pingdom speed test, the Vultr Intel server scores 84 and the loading time is 1.68 seconds. The AMD VPS performs better load time on Pingdom speed tests than the Intel.
AMD vs. Intel VPS: Which is the Fastest?
After all these tests on the two Vutlr VPSs AMD vs. Intel, it became clear to us that the Vultr AMD VPS server is better when a powerful CPU is needed, and it is slightly ahead of the Intel VPS server.
But that doesn’t make Intel servers any bad or it lacks far behind, it’s just that the AMD is better by 0.1 or 0.2 seconds. If you like Intel CPU, go with it.
Vultr has a plan that costs $2.50/month.
Read also:
Install WordPress on Vultr.
Install PHP Script on Vultr.
DigitalOcean vs Vultr vs Linode.